Density of Spaghetti
An introduction to uncertainties in physical measurements. For a later lab we will need the diameter and density of individual strands of spaghetti. In this lab you will measure the average length, diameter, volume, mass, and density of three types of spaghetti.
- [ SPDensity.pdf ] pdf version.
- [ SPDensity.html ] html version.
Contents
Materials and Equipment
For this lab you will need one (1) box of spaghetti (cylindrical pasta), a ruler, and a kitchen scale. If you do not have one of these items, they will be available in the lab.
-
One (1) unopened 16oz boxes of dried spaghetti.
NOT WHOLE WHEAT!
- A ruler at least 12 inches with 1/16 inch rules or at least 30cm with at least 1mm rules. Example from amazon.
- Kitchen scale with 0.01oz or 0.1g accuracy Example from amazon.
Density of Spaghetti I
1) Before opening the box, weigh it and record the results including uncertainty. Then open carefully. Example:
Unopened box:  g
g
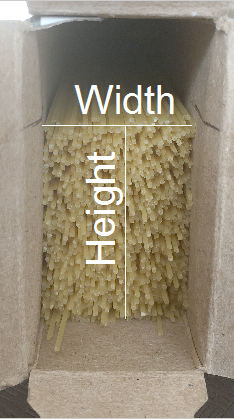
2) Measure the height and width of the spaghetti using your ruler. Try to make the spaghetti as close to a rectangle as possible. Record the values and uncertainty estimates. Example:
Height  cm
cm
Width  cm.
cm.
3) Calculate the area in  . Example:
H=4.9; dH=0.1;
W=3.5; dW=0.1;
A=H*W;
dA=H*W*sqrt((dH/H)^2+(dW/W)^2);
fprintf('A=%f +/- %f (cm)^2',A,dA);
A=17.150000 +/- 0.602163 (cm)^2
Put final result in standard form: Area  .
.
4) [Length Method 1:] Remove the spaghetti and set aside any broken pieces. Take a hand full and align one end against a flat surface. Use the ruler estimate the full range of lengths (solid lines below) and a range that would include ~70% of the lengths (dashed lines below). Report as the average and symmetric range:
Full range:  cm. Probable range:
  cm.
cm.
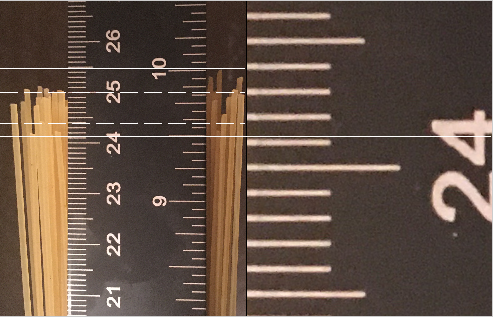
If you zoom in, for example on the lowest line (above, right), you can get sub mm accuracy:  cm. Is this extra accuracy useful in defining the full range or probable range? Why or why not?
5) Use the probable range average above to calculate the total volume in  or
or  of the 3D rectangle containing all of the spaghetti:
L=24.8; dL=0.3;
V=H*W*L;
dV=H*W*L*sqrt((dH/H)^2+(dW/W)^2+(dL/L)^2);
fprintf('V=%f +/- %f (cm)^3',V,dV);
V=425.320000 +/- 15.795079 (cm)^3
Put final result in standard form: Volume  . This volume is the apparent volume of the spaghetti, but the actual strands take up less space. The fraction of space that the spaghetti takes up divided by the apparent volume is called the volume fraction
  or filling fraction. For long rods they fill all space in the long direction, but in the two short directions (the area measured above) they only fill about
  %. So the spaghetti only takes up 80% of the apparent volume. Use this fact to find the actual volume of spaghetti:
phi=0.8; dphi=0.1;
Vs=phi*H*W*L;
dVs=phi*H*W*L*sqrt((dH/H)^2+(dW/W)^2+(dL/L)^2+(dphi/phi)^2);
fprintf('Vs=%f +/- %f (cm)^3',Vs,dVs);
Vs=340.256000 +/- 44.369371 (cm)^3
Put final result in standard form: Spaghetti Volume  .
.
6) Measure the weight of the empty box and find the total weight of the spaghetti:

 .
.
Use the mass and volume find the density of spaghetti in g/cc:
m=467.7; dm=0.14;
rho=m/(phi*H*W*L);
drho=m/(phi*H*W*L)*sqrt((dH/H)^2+(dW/W)^2+(dL/L)^2+(dphi/phi)^2+(dm/m)^2);
fprintf('rho=%f +/- %f g/(cm)^3',rho,drho);
rho=1.374553 +/- 0.179242 g/(cm)^3
Put final result in standard form: Spaghetti Density  .
.
What is the largest source of error in the density measurement? How much does it contribute to the total error? Explain your reasoning. (Hint: what if there was zero error in that quantity.) We can get the most benefit from reducing errors in this quantity. What is the smallest source of error? There is no reason to reduce this error until we have reduced others.
Density of Spaghetti II and Diameter
For later experiments we will need the diameter of the spaghetti. We can also get a better measure of the density using the diameter to calculate the volume.
Numbering the strands For the following measurements of 25 individual strands it is useful to number or order the strands so that we can compare measurments. So when you measure the diameter of a particular strand with one technique you can compare to the same strand in another technique and compare to other measurements like the length. One way to do this is to line up the 25 strands like pictured below for Diameter Method 2) with one end lined up. Then draw a diagonal line across the spaghetti. Then if they get out of order you can easily re-sort them by reconstructing the line.
Diameter Method 1) Select 25 strands at random and measure the diameters of each with the ruler. Record and report in standard form each measurement, as well as, the uncertainty in cm. Calculate the mean and estimate the uncertainty in the mean in cm. Explain your estimate. Would more measurements increase the accuracy in the mean? Why or why not? (Hint: What is the criterion for the accuracy in the mean decreasing with increased measurements?)
Diameter Method 2) Line up the 25 strands side-by-side as tightly as you can (see below). Then measure the length of the 25 strands.
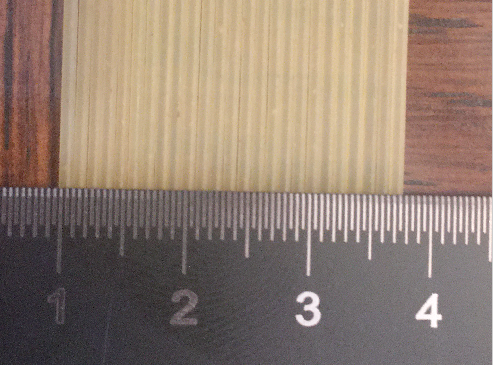
Calculate the average diameter of the strands and the uncertainty in cm and report in standard form. How does this compare with the previous method? Which is more accurate? Why? Are they consistent? Why? You can report the error in symmetric form, but in this case do you think the best estimate is an over-estimate or an under-estimate or unbiased? Why?
Diameter Method 3) Take a picture of the ruler and the 25 strands side-by-side but spaced a little apart (see below). Load the image into your favorite program that can access the individual pixel information. In matlab:
im=imread('dia2.png');  % load image into an array
image(im);              % display image
axis('image');          % set pixels to be square
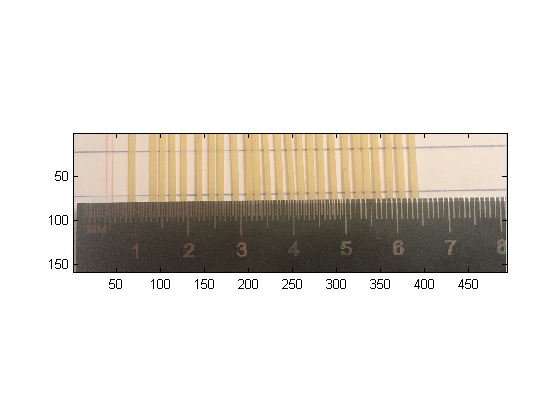
Zoom in and find the distance in pixels between two known rules on the ruler. In matlab there is a zoom tool and data cursor tool. With the data cursor tool selected, matlab will report the pixel positions of the mouse on the image when the mouse is clicked. This measurement will allow you to convert from ruler units to pixels. You should chose two rules which are far apart. Why? Measure the number of pixels across each strand and use that to calculate the diameter of each strands and the uncertainty in cm, as well as, the mean value and uncertainty in the mean.
Best Diameter of Spaghetti: Compare all three methods for measuring the average diameter and choose the best. Are they consistent? Which is most accurate? Why? Explain why the method you choose is best, and how you calculated the error. Report the best diameter for this box and the error estimate in standard form.
Length Method 2) Measure the lengths of the 25 strands using the ruler. Record and report in standard form each measurement, as well as, the uncertainty in cm. Calculate the mean and estimate the uncertainty in the mean in cm. Explain your estimate. Would more measurements increase the accuracy in the mean? Why or why not? (Hint: What is the criterion for the accuracy in the mean decreasing with increased measurements?) Is this measurement consistent with Method 1 from the first part? Which is more accurate? Why? We will not use the picture method on the length. Would it be useful to use the picture method? Why?
Mass Method 1) Measure the mass of the 25 strands using the scale. Record and report in standard form each measurement, as well as, the uncertainty in g. Calculate the mean and estimate the uncertainty of the mean in g.
Often low cost scales have a threshold for registering any weight. That threshold can be much larger than the accuracy. To overcome this problem you may need to put a fixed weight on the scale before you start and measure the difference between the two weights. If you do this remember to include this difference calculation in the error estimate. The fixed weight should be close to the minimum weight to get a measurement. 2-3g is usually enough.
Mass Method 2) Measure the mass in g of all 25 strands at one time. Calculate the average mass of a strand and the uncertainty in g and report in standard form. How does this compare with the previous method? Which is more accurate? Why? Are they consistent? Why? You can report the error in symmetric form, but in this case do you think the best estimate is an over-estimate or an under-estimate or unbiased? Why?
Volume of Strand method 1) Using the best average diameter and average length, calculate the volume of an individual strand assuming the spaghetti is a cylinder. Report the best estimate and error in using standard form.
OPTIONAL Volume of Strand method 2) Choose two rules on a measuring cup, which are a factor of 2 apart. For example, 2oz and 4oz or 50ml and 100ml. (nb: 1ml=1cc=1(cm)^3). For best results the upper measurement should be >= half the total volume of the cup. You will fill the cup up to the lower marking V1 with water and then fill to upper marking V2 with a known number of submerged strands of spaghetti Nst. You will need approximately Nst=(V2-V1)/Vst strands, where Vst is the volume of a strand. Use method 1 to get an estimate of the Vst. The strands will likey need to be broken to fit in the cup. All of the spaghetti must be below the water level. I found it useful to break the spaghetti inside a bag to collect all of the pieces. You also need to do the measurement quickly before the spaghetti absorbs too much water. I counted out 95% of the number I needed ~200, broke those, and added them to the water. Then added 12(full) plus 
 more by hand to reach V2.
Use the total number plus any fraction needed to fill the V2-V1 volume and calculate the volume of an average strand with error estimate in and report in standard form. Explain how you made your error estimate? How could you improve the measurement? Compare with method 1 for consistency. Which is more accurate? Why?
Best Density of Spaghetti (home): Combine the best measurements from above to get the most accurate measure of the density of spaghetti from the first box. Explain why the method you choose is best, and how you calculated the error. Report the best density value and error estimate in standard form.
Better Tools
Best Density of Spaghetti (Lab): To get the best density we can with our lab equipment measure the diameter of each of the 25 strands with the digital caliper. Make 5 measurements of each strand at different locations. Use the 0.01 accurate scale to measure the mass of each strand, and measure the mass of all 25 together. Combine this data with the length measurements above to determine you most accurate density and uncertainty.
Conclusions: Use the best lab data to evaluate the home data. Could we do better with a different measurement of the length?
Clean up
Save the spaghetti for a later lab.
Files
- SPDensity.zip All files in one zip file.
- SPDensity.m (This File).
- SPDensity.pdf (pdf version).
